
A Brier score tells you how good a set of forecasts is overall. A calibration check tells you where it goes wrong: whether your 30% forecasts come true about 30% of the time, and your 70% forecasts about 70%. This tutorial builds a reliability table in pandas and applies it to two forecasters on the same 2,660 Premier League matches: the betting market and the Elo model from Build an Elo Rating System in Python.
It uses the test table from Score Your Model With the Brier Score.
The code
bins = [0, 0.2, 0.4, 0.6, 0.8, 1.0]
test["bin"] = pd.cut(test["mkt_h"], bins)

cal = test.groupby("bin", observed=True).agg(
    matches=("mkt_h", "size"),
    forecast=("mkt_h", "mean"),
    actual=("FTR", lambda r: (r == "H").mean()),
).round(3)
print(cal)
pd.cut puts each match into a bin according to its forecast home-win probability; the table then compares the average forecast in each bin with how often the home team actually won.
The market
| Forecast bin | Matches | Average forecast | Home win rate |
|---|---|---|---|
| 0–20% | 305 | 14.0% | 12.5% |
| 20–40% | 919 | 30.8% | 30.7% |
| 40–60% | 857 | 49.4% | 49.4% |
| 60–80% | 481 | 68.8% | 67.6% |
| 80–100% | 98 | 84.1% | 88.8% |
The middle bins are almost perfect: forecasts of 30.8% came true 30.7% of the time, and 49.4% came true exactly 49.4%. The extremes show small gaps, but they also have the fewest matches.
The Elo model
Change mkt_h to elo_h in the code above:
| Forecast bin | Matches | Average forecast | Home win rate |
|---|---|---|---|
| 0–20% | 294 | 11.9% | 13.6% |
| 20–40% | 746 | 31.0% | 30.2% |
| 40–60% | 970 | 49.8% | 46.8% |
| 60–80% | 650 | 67.8% | 67.1% |
Two things stand out:
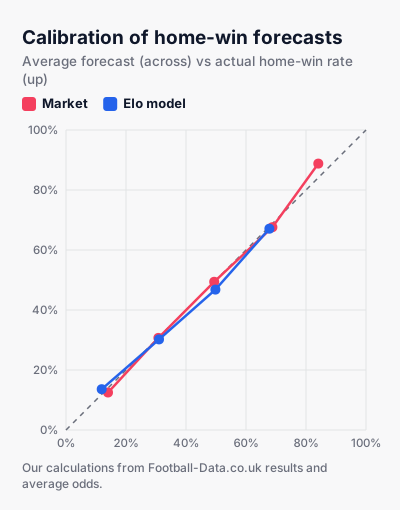
- No forecasts above 80%. Because our Elo model gives every match a fixed 25% draw probability, it can never be very confident about a home win. Its forecasts are squeezed towards the middle.
- The 40–60% bin is too optimistic. Forecasts averaging 49.8% came true only 46.8% of the time, across 970 matches.
Key point: A calibration table turns a single score into a diagnosis. Here it points straight at the weak part of our model: the crude handling of draws, which limits confidence and skews the middle range.
How many matches per bin?
With a few hundred matches in a bin, the observed rate has a standard error of a few percentage points: about 2.2 points for 500 matches at 50%. Gaps smaller than that are mostly noise. The 98 matches in the market's top bin are too few to read much into the 4.7-point gap.
Example: A quick way to estimate the noise: the standard error of a rate p over n matches is the square root of p × (1 − p) ÷ n. For p = 0.5 and n = 500, that is about 0.022, or 2.2 percentage points.
Next steps
- Plot forecast against actual rate with matplotlib; a calibrated model lies on the diagonal.
- Repeat for draws and away wins: draws are where most football models struggle.
- Recalibrate on earlier seasons and test on later ones.
Watch out: Calibration is necessary, not sufficient. A model that always predicts league-average frequencies is perfectly calibrated and useless. Use calibration together with the Brier score.
To experiment with goal-based probabilities instead, try the Poisson match predictor.
pd.cutandgroupbybuild a reliability table in a few lines.- The market's home-win forecasts were very well calibrated over 2,660 matches.
- Our simple Elo model never exceeded 80% and was too optimistic around 50%, pointing to its draw handling.
Sources
- Calibration (statistics) — Wikipedia
- pandas.cut — pandas documentation
18+ only. Models do not guarantee results. See our Responsible Gambling page.