
Building a model is the easy part. Knowing whether it is any good is harder. This tutorial scores three sets of forecasts on the same 2,660 Premier League matches, from 2019-20 to 2025-26: a naive baseline, the Elo model from Build an Elo Rating System in Python and the betting market with its margin removed. The result is a useful dose of realism.
The Brier score
For a match with three outcomes, the Brier score adds up the squared differences between each forecast probability and what happened (1 for the outcome that occurred, 0 for the others). Lower is better: 0 is perfect, and always saying 33% for each outcome scores about 0.667.
def brier(df, cols):
    oh = (df["FTR"] == "H").astype(float)
    od = (df["FTR"] == "D").astype(float)
    oa = (df["FTR"] == "A").astype(float)
    return ((df[cols[0]] - oh) ** 2
            + (df[cols[1]] - od) ** 2
            + (df[cols[2]] - oa) ** 2).mean()
Market probabilities
The data includes average market odds (AvgH, AvgD, AvgA) from 2019-20. Remove the margin by normalising the implied probabilities:
inv = 1 / matches[["AvgH", "AvgD", "AvgA"]]
mkt = inv.div(inv.sum(axis=1), axis=0)
matches[["mkt_h", "mkt_d", "mkt_a"]] = mkt.values
The comparison
test = matches[matches["Season"] >= "1920"].dropna(subset=["AvgH"]).copy()
test["base_h"], test["base_d"], test["base_a"] = 0.45, 0.24, 0.31
for name in ("base", "elo", "mkt"):
    print(name, round(brier(test, [f"{name}_h", f"{name}_d", f"{name}_a"]), 4))
Our results:
| Forecast | Brier score (2,660 matches) |
|---|---|
| Naive baseline (45% / 24% / 31% for every match) | 0.6477 |
| Simple Elo model | 0.5890 |
| Market, margin removed | 0.5745 |
Season by season
| Season | Elo | Market |
|---|---|---|
| 2019-20 | 0.5839 | 0.5750 |
| 2020-21 | 0.6182 | 0.5968 |
| 2021-22 | 0.5700 | 0.5537 |
| 2022-23 | 0.5820 | 0.5737 |
| 2023-24 | 0.5524 | 0.5331 |
| 2024-25 | 0.5938 | 0.5789 |
| 2025-26 | 0.6226 | 0.6100 |
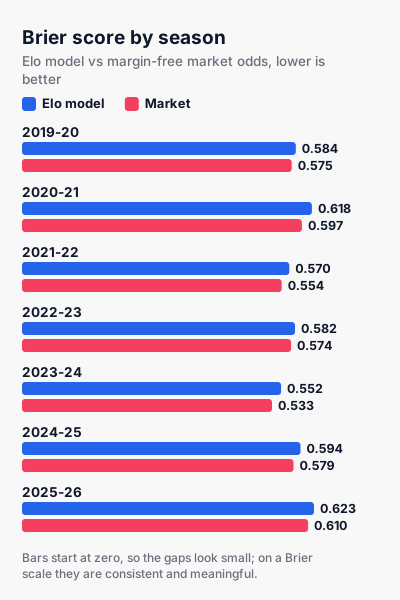
Key point: The market beat the Elo model in every single season. Note also that both did worst in 2020-21, the season played mostly without fans, when home advantage nearly vanished and every model built on normal seasons was miscalibrated.
How to read the gap
The Elo model closes about 80% of the distance between the naive baseline and the market. That is a respectable result for thirty lines of code. But the remaining gap is the part that matters for anyone hoping to beat the market, and it is consistent across seasons. The market includes information our model does not have: injuries, lineups, transfers, the views of many other models.
Watch out: A model that scores worse than the market should not be used to find "value" against it. Before trusting any disagreement with market prices, your model needs to match or beat the market's Brier score over many seasons.
Doing it properly
- Freeze parameters before testing. Choose K and home advantage on earlier seasons, then score later ones once.
- Report every season, not just the best ones.
- Check calibration as well as the overall score. See Check Calibration in Python.
- On 2,660 Premier League matches, the market (0.5745) beat a simple Elo model (0.5890), which beat a naive baseline (0.6477).
- The market was ahead in every season from 2019-20 to 2025-26.
- Only use a model against market prices once it matches the market's score over many seasons.
Sources
- Brier score — Wikipedia
- English football results and data — Football-Data.co.uk
18+ only. Models do not guarantee results. See our Responsible Gambling page.